배열(array)과 그래프
리스트와 배열의 차이
| list | array |
| 서로 다른 자료형 함께 저장 가능 | 동일 자료형만 저장 가능 |
| slow.why? 내부적으로 포인터 사용해 데이터 참조 | fast. why? 데이터에 직접 접근 가능 |
| 파이썬 내장 자료형 사용해서 모듈 필요 없음 | 파이썬 표준 모듈 array 사용 |
따라서 리스트는 다양한 자료형을 저장할 때, 형태가 유동적일 때 유용.
배열은 동일 자료형 데이터를 처리할 때, 빠른 처리 속도가 필요할 때 사용
# 배열과 리스트

## 배열
import array as arr

myarray = arr.array('i', [1,2,3]) # i: int, f: float, d:double, string은 지원 안함
myarray.insert(1,5)
myarray.append(3)


## 리스트
mylist = [1,2,3]

mylist.append(2)
mylist.append(0, 4) # 0번째 인덱스에 4 추가
mylist.insert(1,5)
중앙값
주어진 숫자를 순서대로 배치시 가장 중앙에 위치하는 숫자
예시
n이 홀수인경우
n/2를 반올림한 값
1, 3, 3, 6, 7, 8, 9 => 5
n이 짝수인경우
1, 3, 3, 7, 8, 9 => (3+7)/2 = 5
표준편차
avg = mean(x)

def std_dev(nums, avg):
	texp = 0.0
    for i in range(len(nums)):
    	texp = texp + (nums[i] - avg) **2 # 각 숫자와 평균값의 차이의 제곱
    return (text/len(nums)) ** 0.5
Numpy
빠름, 메모리 효율적 사용다차원 배열 데이터타입(ndarray) 지원다양한 수학 함수 제공
등등 다양한 장점이 있다
# numpy 예제

import numpy as np

#ndarray로 객체 생성
A = np.arrange(5)
B = np.array([1, 2, 3, 4]) # list를 numpy ndarray로 변경
C = np.array([1, 2, 3, '4']) # type이 다르면 전부 str로 고정됨

# 크기
B_re = B.reshape(2, 2) # 1*4를 2*2 형태 행렬로 변경

print(B.shape)
print(B.ndim) # 차원수, 행렬의 축 개수
print(B.size) # 행렬 내 원소의 개수

# type(), dtype

print(B.dtype) # 행렬 B의 데이터의 타입
print(type(B)) # 행렬 B의 타입. 즉 numpy.ndarray


#단위행렬
np.eye(3)

# 영행렬
np.zeros([2,3])

# 1행렬
np.ones([2, 3])
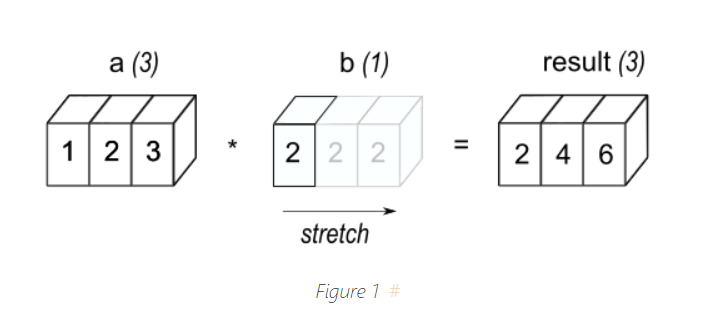
broadcast
numpy에서 제공하는 강력한 기능
ndarray와 상수, 서로 크기가 다른 ndarray끼리 산술연산이 가능한 기능
random
import numpy as np

np.random.rand(3,3) #3,3형태의 난수로 이루어진 행렬 생성
np.random.random() # 0~1사이 실수형 난수 하나 생성
np.random.randint(0, 10) # 0~9 사이 실수형 난수 하나 생성
np.random.permutation(10) # 0~9 사이 무작위로 섞인 배열 생성
np.random.choice([1,2,3]) # 값 하나 랜덤하게 선택
np.random.normal(loc=0, scale=1, size=5) #정규분포 형태, loc: 평균, scale:표준편차, size:추출개수
np.random.uniform(low=-1, high=1, size=5) # 균등분포 형태, low:최소, high:최대, size:추출개수
전치행렬
arr.T : 행렬의 행과 열 맞바꾸기
arr.transpose: 축 기준 행렬의 행과 열 바꾸기
np.transpose(A, (2,0,1)) #A의 3,1,2 번째 축을 자신의 1,2,3번째 축으로 가진 행렬
numpy가 여러 데이터를 표현하는 법
| 소리 | 1차원 array |
| 흑백 이미지 | 가로*세로, 0~255 사이 값을 갖는 2차원 ndarray |
| 컬러 이미지 | 세로*가로*3 형태의 0~255 사이 값을 갖는 2차원 ndarray 이때 3은 rgb 값 의미 |
| 자연어 | 문장 데이터를 단어별로 나누고 이를 넘버링(토큰화) 만든 토큰에 대하여 word2vec embedding을 통해 [batch_size, sequence_length, embedding_size]의 ndarray로 표현 |
이미지와 관련된 파이썬 라이브러리
matplotlib
PIL
# 이미지 열기

from PIL import Image, ImageColor
import os
img_path = '이미지 주소'
img = Image.open(img_path).convert('L') #.convert('L') : 흑백모드로 변경
print(img_path)
print(type(img))
img

#이미지 크기
W,H = img.size

# 이미지 파일 타입
img.format

# 이미지 색상 정보
img.mode

# 이미지 자르기
img.crop((30,30,100,100)) #가로시작점, 세로시작점, 가로종료점, 세로종료점

#자른 이미지 저장
cropped_img_path = '저장위치/파일명.jpg'
img.crop((30,30,100,100)).save(cropped_img_path)

# 이미지 파일을 행렬로 변환 by np.array()
import numpy as np
img_arr = np.array(img)
print(type(img)) #PIL.JepgImagePlugin
print(type(img_arr))
print(img_arr.shape) #Height X Width X RGB Channel
print(img_arr.ndim) #3

ImageColor.getcolor('RED', 'RGB') # RED가 RGB에서 어떤 숫자로 표현될지 (255,0,0)
구조화된 데이터
딕셔너리에 딕셔너리를 갖는 형태처럼 데이터 내부에 자체적인 서브 구조를 가지는 데이터
hash
다른 언어에서의 매핑, 연관배열, 파이썬에서의 딕셔너리를 의미함
어떤 데이터의 값을 찾을 때 인덱스가 아닌 key를 이용해 데이터에 접근하는 데이터 구조
key, value 2개의 열을 가짐
데이터를 빠르게 검색할 수 있음
pandas series
import pandas as pd
ser = pd.Series(['a','b','c',3])

ser.values # 데이터값

ser.index # 인덱스 # RangeIndex(start=0, stop=4, step=1)

# 인덱스 설정해서 넣기
ser2 = pd.Series(['a', 'b', 'c', 3], index=['i','j','k','h'])
ser2

# 인덱스 변경
ser2.index = ['Jhon', 'Steve', 'Jack', 'Bob']
ser2 # Index(['Jhon', 'Steve', 'Jack', 'Bob'], dtype='object')

#딕셔너리 형태로 시리즈로 변경 가능
ser3 = pd.Series(딕셔너리) # 딕셔너리 키가 인덱스가 됨

# name 속성으로 이름 설정 가능
ser3.name = 'Country_PhoneNumber'
ser3.index.name = 'Country_Name'
pandas dataframe
한개의 인덱스컬럼, 값 컬럼을 갖는 시리즈와 다르게 데이터프레임은 여러 컬럼을 나타낼 수 있다.
data = {'Region' : ['Korea', 'America', 'Chaina', 'Canada', 'Italy'],
        'Sales' : [300, 200, 500, 150, 50],
        'Amount' : [90, 80, 100, 30, 10],
        'Employee' : [20, 10, 30, 5, 3]
        }

# 데이터프레임으로 변환
d = pd.DataFrame(data)

# 컬럼명
d.columns

# 인덱스 정보
d.index # RangeIndex(start=0, stop=5, step=1)

# 인덱스, 컬럼 내용 변경
d.index=['one','two','three','four','five']
d.columns = ['a','b','c','d']
eda에 넣으면 좋은 내용
df.head()

df.tail()

df.columns

df.info()

df.describe()

df.isnull().sum()

df['컬럼명'].value_counts()

# 중요! 상관관계 확인
df['컬럼1'].corr(df['컬럼2'])
df.corr()

# 이외 유용한 메서드
count() # NA를 제외한 수를 반환
describe() # 요약 통계를 계산
min(), max() #최소, 최댓값을 계산
sum() # 합을 계산
mean() #평균을 계산
median() #중앙값을 계산
var() #분산을 계산
std(): #표준편차를 계산
argmin(), argmax() #최소, 최댓값을 가지고 있는 값을 반환
idxmin(), idxmax() #최소, 최댓값을 가지고 있는 인덱스를 반환
cumsum(): #누적 합을 계산
pct_change() # 퍼센트 변화율을 계산
복습할 내용
https://pandas.pydata.org/pandas-docs/stable/user_guide/10min.html
10 minutes to pandas — pandas 2.0.2 documentation
10 minutes to pandas This is a short introduction to pandas, geared mainly for new users. You can see more complex recipes in the Cookbook. Customarily, we import as follows: In [1]: import numpy as np In [2]: import pandas as pd Object creation See the In
pandas.pydata.org
ndarray와 series
둘 다 다차원 데이터를 처리하기 위한 파이썬 라이브러리이지만 이 둘은 몇 가지 중요한 차이점이 있다.
NumPy의 배열은 단일 데이터 타입을 가지며, 모든 요소가 동일한 데이터 타입을 가진다.
또한, 배열은 다차원 데이터를 처리하는 데에 최적화되어 있어, 배열의 연산 속도가 빠르고 메모리 사용량도 적다.
반면, Pandas의 시리즈는 인덱스와 데이터를 모두 포함하는 자료구조로 다양한 데이터 타입을 저장할 수 있다.
또한, 시리즈는 데이터 프레임 (DataFrame)의 구성요소 중 하나이며, 데이터를 구조적으로 보관하고 처리하는 데에 최적화되어 있다.
따라서, NumPy의 배열은 다차원 숫자 데이터 처리에 특화되어 있고, Pandas의 시리즈는 인덱스와 함께 다양한 데이터 타입을 처리하는 데에 특화되어 있다.
데이터시각화
matplotlib, seaborn 이용
# 데이터 정의

import matplotlib.pyplot as plt
%matplotlib inline # 매직 메서드

# 그래프 데이터
subject = ['English', 'Math', 'Korean', 'Science', 'Computer']
points = [40, 90, 50, 60, 100]

# 축 그리기
fig = plt.figure() #도화지(그래프) 객체 생성
ax1 = fig.add_subplot(1,1,1) #figure()객체에 add_subplot 메서드를 이용해 축을 그려준다. # nrows, ncols, index

# 그래프 여러개 그리기
fig = plt.figure()
ax1 = fig.add_subplot(2,2,1)
ax2 = fig.add_subplot(2,2,2)
ax3 = fig.add_subplot(2,2,4)
그래프 그리기
범주형 데이터
barplot, violin plot, subplot, catplot 등등...
수치형 데이터
산점도, 선그래프, 히스토그램, 밀도그래프(kde) 등등...
# 그래프 데이터
subject = ['English', 'Math', 'Korean', 'Science', 'Computer']
points = [40, 90, 50, 60, 100]

# bar 그래프
ax1.bar(subject,points) # (x,y)


# 그래프 요소 추가
plt.xlabel('Subject')
plt.ylabel('Points')
plt.title("Yuna's Test Result")
주석(annotation)을 활용한 그래프 그리기
from datetime import datetime
import pandas as pd
import os

# 그래프 데이터
csv_path = os.getenv("HOME") + "/aiffel/data_visualization/data/AMZN.csv"
data = pd.read_csv(csv_path, index_col=0, parse_dates=True)
price = data['Close']

# 축 그리기 및 좌표축 설정
fig = plt.figure()
ax = fig.add_subplot(1,1,1)
price.plot(ax=ax, style='black')

#x, y 값 범위 설정
plt.ylim([1600, 2200])
plt.xlim(['2019-05-01', '2020-03-01'])

# 주석달기 by annotate()
important_data = [(datetime(2019, 6, 3), "Low Price"), (datetime(2020, 2, 19), "Peak Price")]

for d, label in important_data:
	# df.asof(d) 주어진 타임스탬프 d와 가장 가까운 df의 값 반환
    ax.annotate(label, xy=(d, price.asof(d)+10), # 주석을 달 좌표(x,y)
                xytext=(d, price.asof(d)+100), # 주석 텍스트가 위치할 좌표(x,y)
                arrowprops=dict(facecolor='red')) # 화살표 추가 및 색 설정

# 그리드, 타이틀 달기
plt.grid()
ax.set_title('StockPrice')

# 보여주기
plt.show()
plt.plot()
figure() 객체 생성 및 서브플롯 생성 과정 생략 가능
import numpy as np

# 0에서 10까지 균등한 간격으로 100개의 숫자를 만들라
x = np.linspace(0, 10, 100)

# 서브플롯 추가
plt.subplot(2, 1, 1)
plt.plot(x, np.sin(x), 'o')

plt.subplot(2,1,2)
plt.plot(x, np.cos(x), '--', color='black')

plt.show()
linestyle 설정
x = np.linspace(0, 10, 100)

plt.plot(x, x + 0, linestyle='solid')
plt.plot(x, x + 1, linestyle='dashed')
plt.plot(x, x + 2, linestyle='dashdot')
plt.plot(x, x + 3, linestyle='dotted')
plt.plot(x, x + 0, '-g') # solid green
plt.plot(x, x + 1, '--c') # dashed cyan
plt.plot(x, x + 2, '-.k') # dashdot black
plt.plot(x, x + 3, ':r'); # dotted red
plt.plot(x, x + 4, linestyle='-') # solid
plt.plot(x, x + 5, linestyle='--') # dashed
plt.plot(x, x + 6, linestyle='-.') # dashdot
plt.plot(x, x + 7, linestyle=':'); # dotted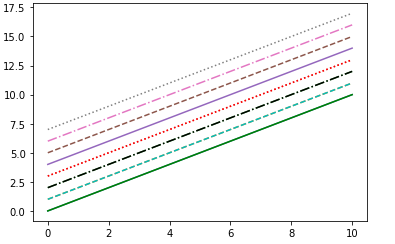
pandas로 그래프 그리기
데이터프레임.plot() 형태로 그래프를 그릴 수 있다.
fig, axes = plt.subplots(2,1)

df.plot(kind='그래프 종류', ax=axes[0], color='color', alpha='투명도')

plt.show()
matplotlib에 데이터를 인자로 넣을 때 pandas 데이터를 바로 이용할 수는 없다.
데이터를 x에 seires 또는 list 형태로, y에는 list 형태로 각각 나눠 주어야 한다.
grouped = df['tip'].groupby(df['day']) # 요일에 따른 팁 평균 그래프를 그려보자

daytip = dict(grouped.mean()) #딕셔너리 형태로 변경

x = list(daytip.keys())
y = list(daytip.values())

plt.bar(x=x, height=y)
plt.ylabel('tip[$]')
plt.title('Tip by Day')
plt.show()
seaborn과 matplotlib를 활용한 방법
import seaborn as sns

plt.figure(figsize=(10,6)) # 도화지 사이즈
sns.barplot(data=df, x='sex', y='tip')
plt.ylim(0, 4) # y값의 범위
plt.title('Tip by sex') # 그래프 제목

# 여러개 그래프 그리기
fig = plt.figure(figsize=(10,7))

ax1 = fig.add_subplot(2,2,1)
sns.barplot(data=df, x='day', y='tip', palette="ch:.25")

ax2 = fig.add_subplot(2,2,2)
sns.barplot(data=df, x='sex', y='tip')

ax3 = fig.add_subplot(2,2,4)
sns.violinplot(data=df, x='sex', y='tip')

ax4 = fig.add_subplot(2,2,3)
sns.violinplot(data=df, x='day', y='tip', palette="ch:.25")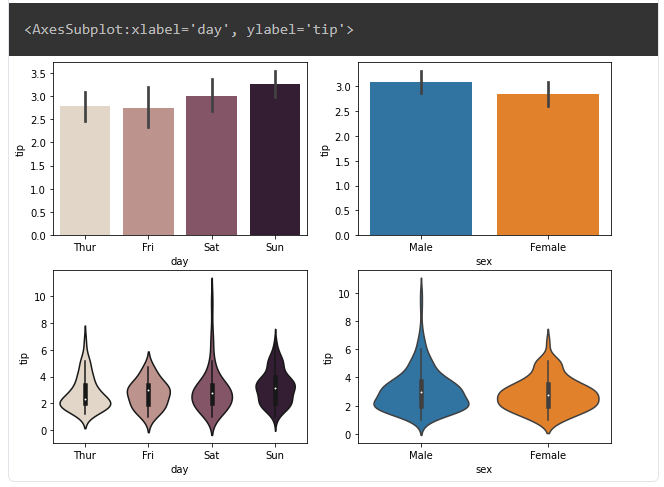
hist plot
#그래프 데이터
mu1, mu2, sigma = 100, 130, 15
x1 = mu1 + sigma*np.random.randn(10000)
x2 = mu2 + sigma*np.random.randn(10000)

# 축 그리기
fig = plt.figure()
ax1 = fig.add_subplot(1,1,1)

# 그래프 그리기
patches = ax1.hist(x1, bins=50, density=False)  # bins는 x값을 총 50개 구간으로
patches = ax1.hist(x2, bins=50, density=False, alpha=0.5)
ax1.xaxis.set_ticks_position('bottom')  # x축의 눈금을 아래 표시
ax1.yaxis.set_ticks_position('left')  # y축의 눈금을 왼쪽에 표시

# 라벨, 타이틀 달기
plt.xlabel('Bins')
plt.ylabel('Number of Values in Bin')
ax1.set_title('Two Frequency Distributions')

# 보여주기
plt.show()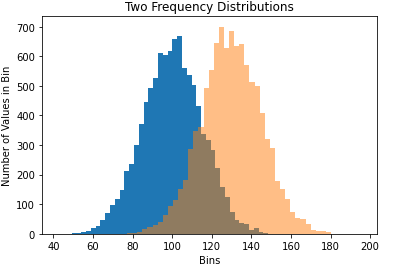
# seaborn 활용한 그래프

sns.histplot(df['tip_pct'], label='tip').legend()
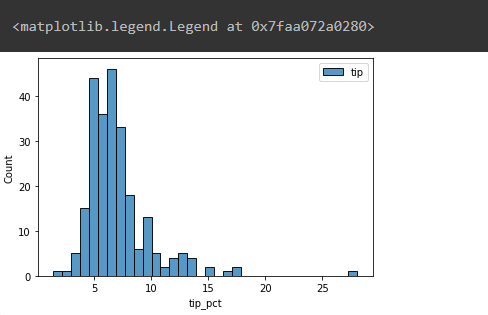
sns.lineplot(data=flights, x='year', y='passengers', hue='month', palette='ch:.50')
plt.legend(bbox_to_anchor=(1.03, 1), loc=2) #legend 그래프 밖에 추가하기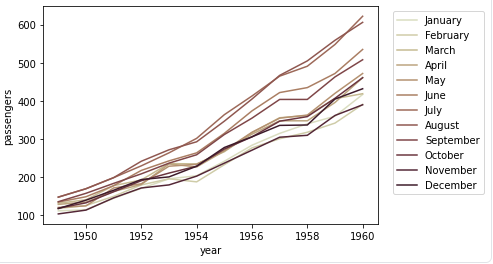
Heatmap
# heatmap을 그리기 위해 데이터를 pivot함
pivot = flights.pivot(index='year', columns='month', values='passengers')

# 그래프 그리기
sns.heatmap(pivot, linewidths=.2, annot=True, fmt="d") #heatmap 사이 간격, 주석, 데이터값 형식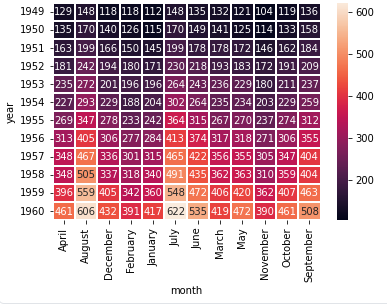
'AI Theory > key concept of AI' 카테고리의 다른 글
| 데이터 전처리 기법들 (0) | 2023.06.28 |
|---|---|
| 사이킷런 머신러닝 (0) | 2023.06.28 |
| 파이썬 더 잘 알기 (0) | 2023.06.26 |
| [boostcourse beyond ai] 딥러닝의 역사 (0) | 2023.05.28 |
| 분류 평가지표 (0) | 2023.05.07 |


